Hello everyone, in this article we are going to create a catchment area on ArcGIS from a DEM file. We are going to discuss catchment analysis. I need to do a catchment analysis for my client. They took BLEG and Stream sediment samples in their project area. It is important to perform the catchment analysis against their data. I am going to use ArcGIS software to do this. In this article, I will only explain the steps to do the watershed/catchment creation. You may read the idea or what is catchment analysis here.
Prerequisites
In order to do catchment analysis on ArcGIS, we will need the following:
- DEM (Digital Elevation Model) or DSM (Digital Surface Model).
- Pour points data
- ArcGIS with Spatial Analyst license
Steps to Create Catchment Area on ArcGIS
Basically, the steps to create the Catchment area on ArcGIS are the following:
- Create DEM
- Fill DEM
- Create Flow Direction
- Flow Accumulation
- Create Pour points
- Snap pour points
- Create Watershed
Step 1. Build the DEM
If you don’t have the DEM ready yet, we can easily create the DEM from elevation points. Please read my previous article to create DEM from the elevation points on ArcMap. The following DEM was generated from many regular points with elevation data in the attribute.
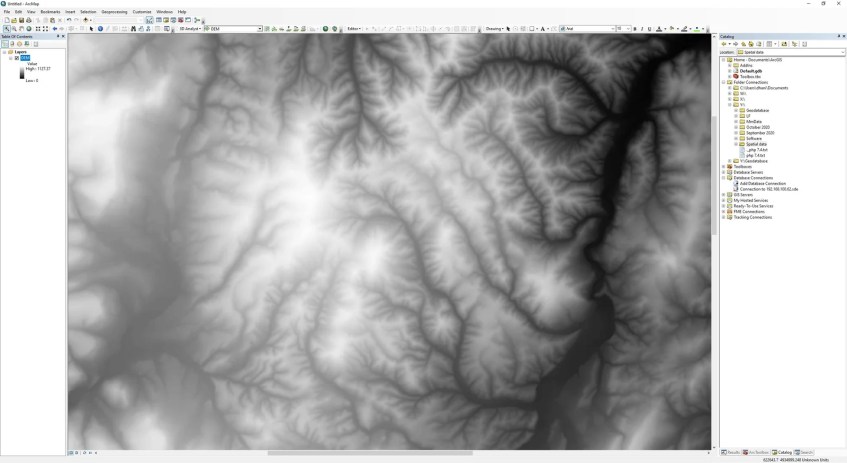
Step 2. Fill the DEM
Once we have the DEM, now we need to fill the DEM. Fills sinks in a surface raster to remove small imperfections in the data. Go to Toolbox>>Spatial Analyst>>Hydrology>>Fill. Choose the DEM as the input surface raster. And then specify the output surface raster.
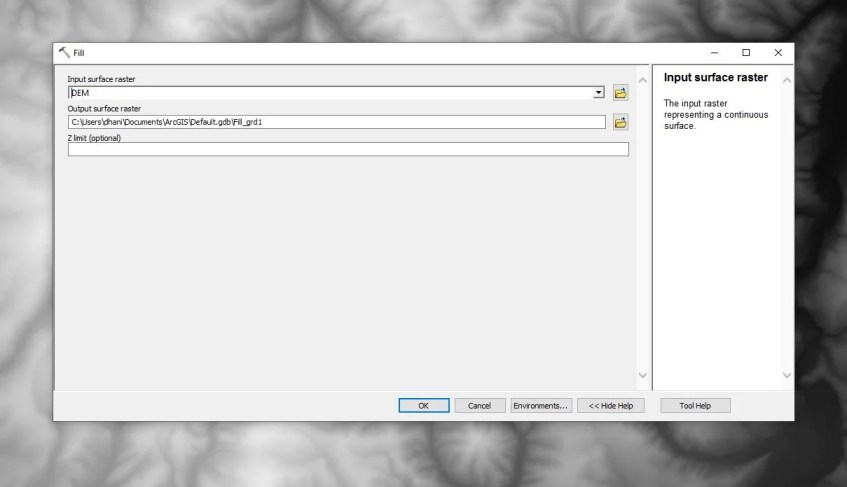
Click OK to run the process. In a few moments, we should have a new DEM opened. Most of the time, we cannot see the differences between before and after the Fill process with bare eyes. After this process, we will have a pretty similar result as step 1. Give a proper name for the output from this Fill process because we will use this for the next step.
Step 3. Flow Direction
The next step is to perform the Flow Direction. We are going to use the Flow Direction tool under Spatial Analyst Tools >> Hydrology.
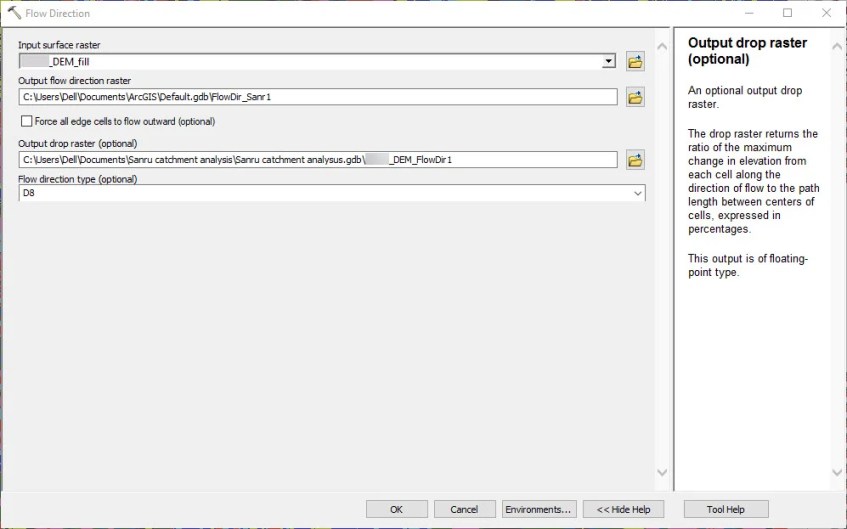
On the input surface layer, select the DEM from the step 2. Make sure to choose the DEM that already processed using Fill. Specify the output raster and press OK. You may change or play with other settings but in most cases, we can use the default value for the other options. Below is the result after we apply this Flow Direction tool.

Step 4. Create Flow Accumulation
The next step after we created the Flow Direction is to create the Flow Accumulation. We will use the Flow Accumulation tool under Hydrology and we will use the flow direction file we created from the step 3 as the base file.
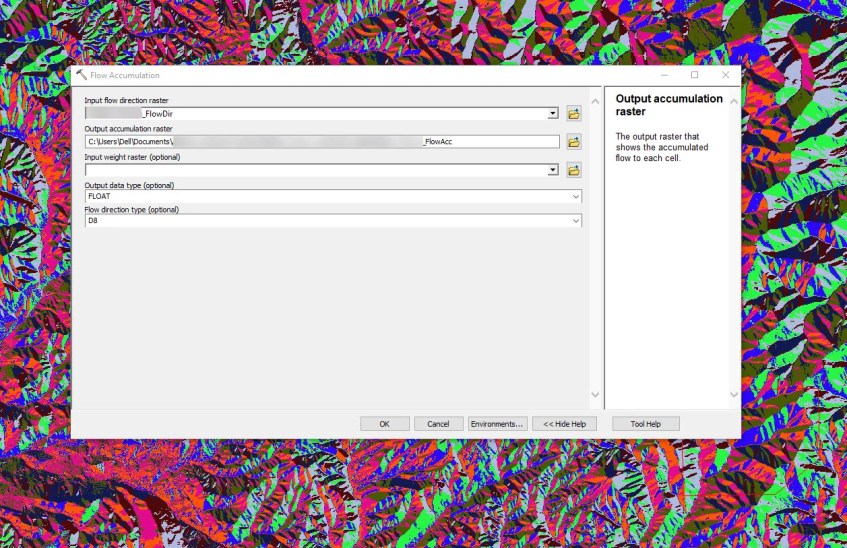
Choose the input flow direction raster as the source file and don’t forget to save the Flow accumulation output raster.
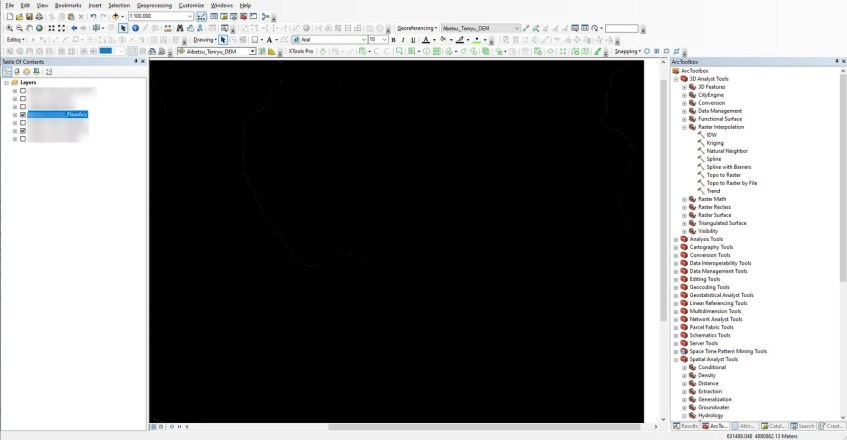
To improve the visibility of the flow accumulation raster, you can play with the symbology. Double-click the flow accumulation raster layer and then go to the Symbology tab. Choose classified and then choose 2 classes. Click Classify and play around with the break number.
At this point, we have successfully created the flow accumulation raster. The next step is to create the pour points.
Step 5. Create the Pour Points
We need to determine the point on the area that we want to delineate the contributing/catchment area. We can manually digitize these points directly on ArcMap, or we can also use existing points if we have it. In this example, I will directly digitize the points on ArcMap.
First, let’s create a new point feature. Edit the new point layer and start digitizing. Try to snap the points to the flow accumulation raster.

The green points are the pour points.
Step 6. Snap Pour Points
After we created the pour points, we will snap these points to the Flow Accumulation raster. We can do this automatically using Snap Pour Points tool. Open the tool from Spatial Analyst Tool >> Hydrology >> Snap Pour Points.
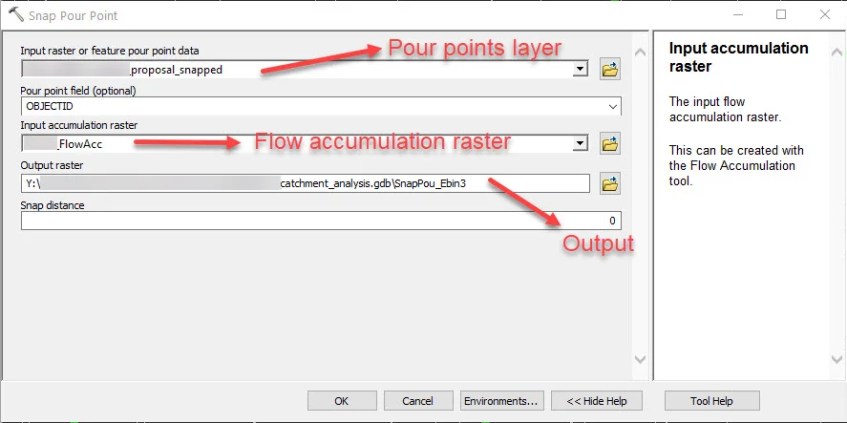
The output raster on this process will be used on the next step.
Step 7. Create Catchment Area (Watershed)
After we snap the pour points, now we can create the Watershed or catchment area. Go to Spatial Analyst Tool >> Hydrology >> Watershed. In this step, we need to select the flow direction raster and the snapped pour point raster we created earlier.

Click OK and the process will start. Below is the watershed result
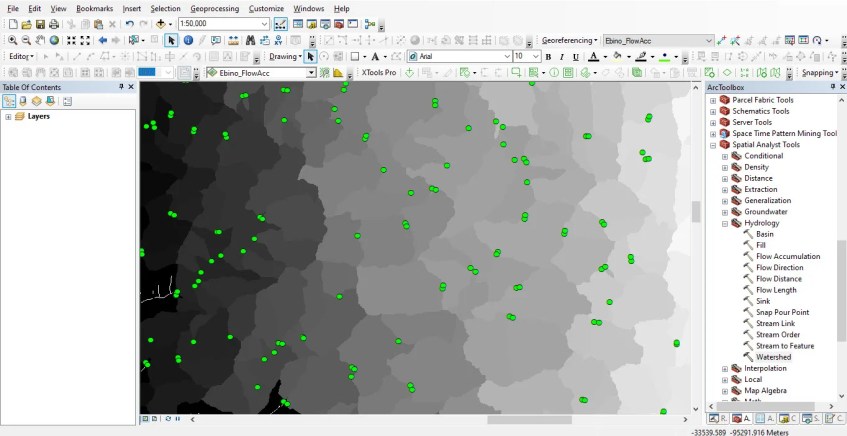
We can modify the symbology so it can be visualized better. Use the Unique Values and then make sure to Add all values.

Result
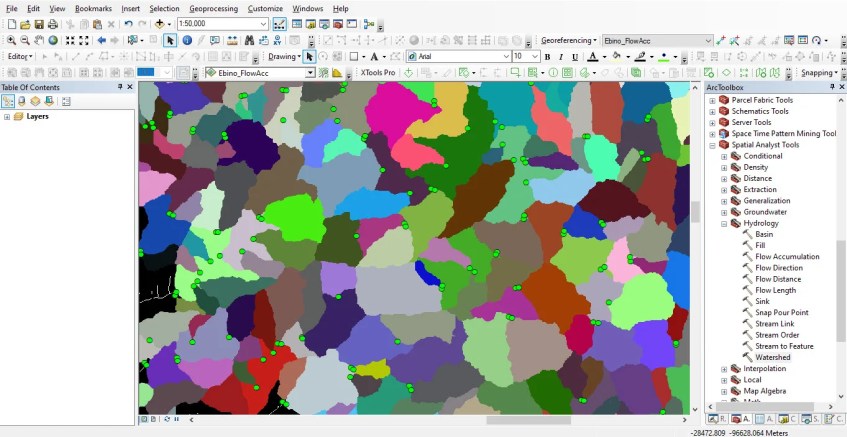
At this point, we have successfully created the watershed or catchment area in ArcGIS. It is still in raster format. If you want to convert it into a polygon feature, you can use the Raster to Polygon tool. It is located under Conversion Tools >>From Raster.

Select the watershed/catchment raster as the input layer. Specify the output polygon feature and press OK.

Hello,
I am a GIS technician at a local Municipality in New York. I am looking to do a similar analyses for my township. I just had a question about your workflow. For the Digitized Points, what was the process for determining where to locate said points? I have a shapefile with Recharge basins. Would that be a good dataset to use for point data?
I have created individual watersheds for singular points, but to have the entire region mapped the way your Result Image is would be very beneficial as it shows which pour point any location in the region would drain to.
Thank you,
Jon
Hi hello,
The very first step would be analyzing the creek/river. We put our points on the location where we think that in that place there will be sedimentation from the upper streams.
We want to analyze the stream sediment (Au, Ag, etc.) in that location which is accumulated from the upper stream.
I hope that helps.
I may have not phrased my question correctly. I am looking to create catchment areas for residential areas that do not contain streams. It looks in your last image that the polygons cover the entire region and if you were to pick any location it would fall within a specific colored polygon and therefore drain to one of the set green circle pour points. How were you able to determine where to place the green dots? I have created singluar point points and catchment areas but how do you ensure that one point isnt interrupting a larger watershed?
I am sorry man. I may not know the answer to your question.
In our case, we design our points mainly on the junction where we can catch the catchment. And then we build the polygon from that points automatically.