GIS Tutorial
  • Home
  • About
  • Contact

Popular Posts

How to open Mapinfo TAB file on QGIS
QGIS,

How to open Mapinfo TAB file on QGIS

by adminJanuary 1, 20181 comment
How to Export Layer to Shapefile on QGIS
QGIS,

How to Export Layer to Shapefile on QGIS

by adminSeptember 21, 2018no comment
How to Create a GeoPackage on QGIS 3.2
QGIS,

How to Create a GeoPackage on QGIS 3.2

by adminJuly 25, 2018no comment
How to convert polyline to polygon on QGIS 3.0
QGIS,

How to convert polyline to polygon on QGIS 3.0

by adminJune 12, 2018no comment

Category List

  • ArcGIS (83)
  • Database (58)
  • Free Spatial Data (2)
  • General (6)
  • Geoserver (2)
  • GIS Software (23)
  • Global Mapper (20)
  • Leapfrog Geo (16)
  • Linux (9)
  • macOS (2)
  • Mapinfo (40)
  • Micromine (32)
  • Oracle (6)
  • Programming (8)
  • QGIS (105)
  • Software Review (2)
  • Surfer (2)
  • Uncategorized (6)

Follow Us

Instagram

Instagram has returned invalid data.
GIS Tutorial
  • Home
  • About
  • Contact
QGIS,

How to Open Excel File in QGIS

by adminDecember 8, 20181 comment
1
Shares
Share on FacebookShare on Twitter
create points

Hello, welcome to QGIS Tutorial. In this article, I am going to show you how to open Excel file in QGIS. I am using QGIS version 3.4.2 on Ubuntu 18.10. You may want to read how to install QGIS on Ubuntu 18.04. It’s pretty similar to open Excel file in ArcGIS. QGIS supports Excel (.xlsx, .xls) as well as CSV and DBF file. After we open the file in QGIS, we can directly edit the Excel file in QGIS. In this example, I have an Excel file with coordinate information.

Steps to Open Excel File in QGIS

  • Open QGIS
  • Drag and drop the excel file from QGIS browser to Canvas
  • Or go to Layer
  • Click Add layer | Add Vector Layer
  • Browse your Excel file and then click Add

Since Excel file does not have spatial information, it will not be plotted in the Canvas. But, if the file has coordinate information, we can easily plot it using the X and Y data.

How to Create Points from Excel File

If you have X and Y data in your Excel file, you can plot or display it as points. First, open the Processing Toolbox and then double-click Create points layer from table.
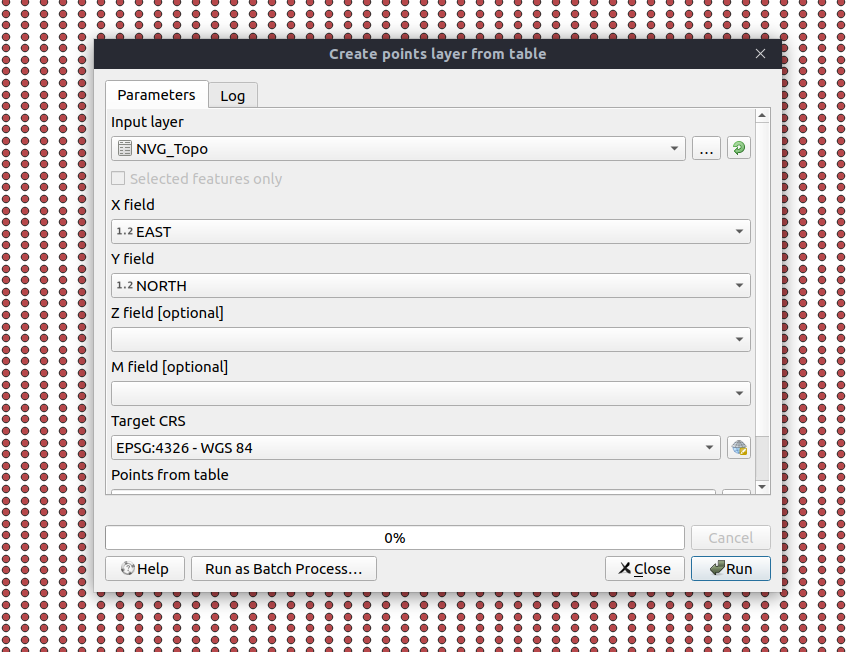
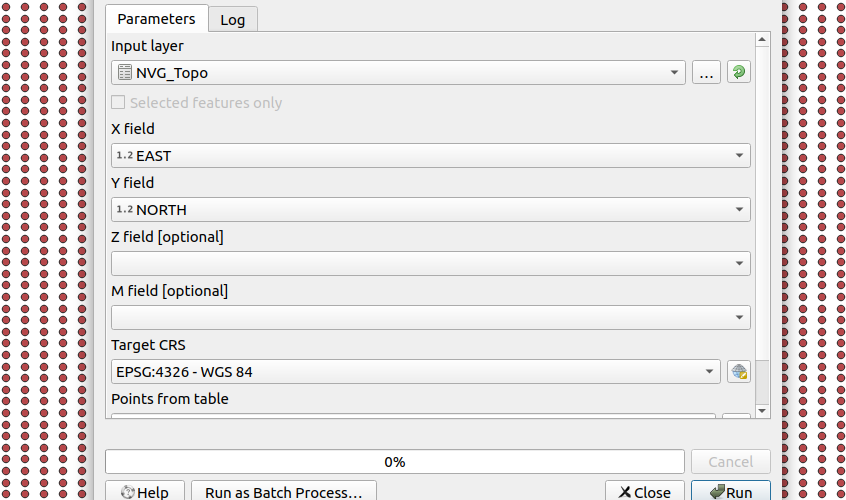
Select the input layer and specify the X and Y fields. Hit Run to start the process.

excelqgis tutorial
Previous

How to Create Hillshade Raster from SRTM on ArcGIS 10.6

December 6, 2018
Next

How to Create PostgreSQL ODBC Connection on Windows 10

December 30, 2018

1 Comment

Neil

July 19, 2021

Is there a way to save this scratch file?
Also I can’t do this in an existing project and actually see the points. It only shows points as a layer in its own project.
I also have a spreadsheet plug in but it never shows a visible vector file.

Reply

Leave a Reply Cancel reply

This site uses Akismet to reduce spam. Learn how your comment data is processed.

Trending

  • How to Install Microsoft SQL Server Driver for Tableau in Apple Silicon Mac

    How to Install Microsoft SQL Server Driver for Tableau in Apple Silicon Mac

    3 days ago
  • Step by Step Installing Oracle Spatial Studio on Windows Server 2022

    Step by Step Installing Oracle Spatial Studio on Windows Server 2022

    1 month ago
  • Install GeoServer on Windows 11

    Install GeoServer on Windows 11

    2 months ago
  • How Enable GeoRaster Support on Oracle Database Schema

    How Enable GeoRaster Support on Oracle Database Schema

    2 months ago

Ads


Ads


Pages