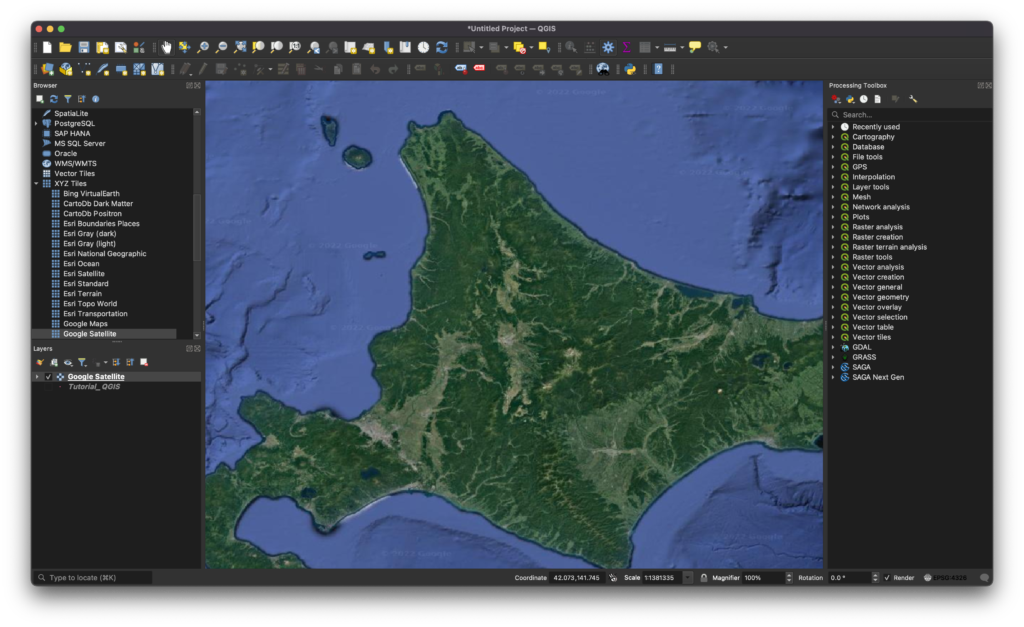
QGIS is a great free GIS software that can display various data sources. For both online and offline data sources, QGIS can open them. In my previous article, we learned how to add some satellite data sources such as Google Satellite into QGIS. Basically, we can add the data source manually by adding the source one by one. In this article, we will add multiple Satellite Imagery data sources to QGIS using one single script. Also, there are some QGIS plugins that can be used to add the satellite imagery layer into QGIS.
The best and easiest way to add the satellite layer into QGIS is by using the XYZ tiles. Normally, we need to type the connection url manually, for example: http://ecn.t3.tiles.virtualearth.net/tiles/a{q}.jpeg?g=1. But, with this script we can automatically add multiple XYZ tiles to QGIS.

Step to add multiple online satellite sources to QGIS
Go to Plugins | Python Console and then copy and paste the following script into the Python window.
# Sources
sources = []
sources.append(["connections-xyz","Google Maps","","","","https://mt1.google.com/vt/lyrs=m&x=%7Bx%7D&y=%7By%7D&z=%7Bz%7D","","19","0"])
sources.append(["connections-xyz","Google Satellite", "", "", "", "https://mt1.google.com/vt/lyrs=s&x=%7Bx%7D&y=%7By%7D&z=%7Bz%7D", "", "19", "0"])
sources.append(["connections-xyz","Google Terrain", "", "", "", "https://mt1.google.com/vt/lyrs=t&x=%7Bx%7D&y=%7By%7D&z=%7Bz%7D", "", "19", "0"])
sources.append(["connections-xyz","Google Terrain Hybrid", "", "", "", "https://mt1.google.com/vt/lyrs=p&x=%7Bx%7D&y=%7By%7D&z=%7Bz%7D", "", "19", "0"])
sources.append(["connections-xyz","Google Satellite Hybrid", "", "", "", "https://mt1.google.com/vt/lyrs=y&x=%7Bx%7D&y=%7By%7D&z=%7Bz%7D", "", "19", "0"])
sources.append(["connections-xyz","Stamen Terrain", "", "", "Map tiles by Stamen Design, under CC BY 3.0. Data by OpenStreetMap, under ODbL", "http://tile.stamen.com/terrain/%7Bz%7D/%7Bx%7D/%7By%7D.png", "", "20", "0"])
sources.append(["connections-xyz","Stamen Toner", "", "", "Map tiles by Stamen Design, under CC BY 3.0. Data by OpenStreetMap, under ODbL", "http://tile.stamen.com/toner/%7Bz%7D/%7Bx%7D/%7By%7D.png", "", "20", "0"])
sources.append(["connections-xyz","Stamen Toner Light", "", "", "Map tiles by Stamen Design, under CC BY 3.0. Data by OpenStreetMap, under ODbL", "http://tile.stamen.com/toner-lite/%7Bz%7D/%7Bx%7D/%7By%7D.png", "", "20", "0"])
sources.append(["connections-xyz","Stamen Watercolor", "", "", "Map tiles by Stamen Design, under CC BY 3.0. Data by OpenStreetMap, under ODbL", "http://tile.stamen.com/watercolor/%7Bz%7D/%7Bx%7D/%7By%7D.jpg", "", "18", "0"])
sources.append(["connections-xyz","Wikimedia Map", "", "", "OpenStreetMap contributors, under ODbL", "https://maps.wikimedia.org/osm-intl/%7Bz%7D/%7Bx%7D/%7By%7D.png", "", "20", "1"])
sources.append(["connections-xyz","Wikimedia Hike Bike Map", "", "", "OpenStreetMap contributors, under ODbL", "http://tiles.wmflabs.org/hikebike/%7Bz%7D/%7Bx%7D/%7By%7D.png", "", "17", "1"])
sources.append(["connections-xyz","Esri Boundaries Places", "", "", "", "https://server.arcgisonline.com/ArcGIS/rest/services/Reference/World_Boundaries_and_Places/MapServer/tile/%7Bz%7D/%7By%7D/%7Bx%7D", "", "20", "0"])
sources.append(["connections-xyz","Esri Gray (dark)", "", "", "", "http://services.arcgisonline.com/ArcGIS/rest/services/Canvas/World_Dark_Gray_Base/MapServer/tile/%7Bz%7D/%7By%7D/%7Bx%7D", "", "16", "0"])
sources.append(["connections-xyz","Esri Gray (light)", "", "", "", "http://services.arcgisonline.com/ArcGIS/rest/services/Canvas/World_Light_Gray_Base/MapServer/tile/%7Bz%7D/%7By%7D/%7Bx%7D", "", "16", "0"])
sources.append(["connections-xyz","Esri National Geographic", "", "", "", "http://services.arcgisonline.com/ArcGIS/rest/services/NatGeo_World_Map/MapServer/tile/%7Bz%7D/%7By%7D/%7Bx%7D", "", "12", "0"])
sources.append(["connections-xyz","Esri Ocean", "", "", "", "https://services.arcgisonline.com/ArcGIS/rest/services/Ocean/World_Ocean_Base/MapServer/tile/%7Bz%7D/%7By%7D/%7Bx%7D", "", "10", "0"])
sources.append(["connections-xyz","Esri Satellite", "", "", "", "https://server.arcgisonline.com/ArcGIS/rest/services/World_Imagery/MapServer/tile/%7Bz%7D/%7By%7D/%7Bx%7D", "", "17", "0"])
sources.append(["connections-xyz","Esri Standard", "", "", "", "https://server.arcgisonline.com/ArcGIS/rest/services/World_Street_Map/MapServer/tile/%7Bz%7D/%7By%7D/%7Bx%7D", "", "17", "0"])
sources.append(["connections-xyz","Esri Terrain", "", "", "", "https://server.arcgisonline.com/ArcGIS/rest/services/World_Terrain_Base/MapServer/tile/%7Bz%7D/%7By%7D/%7Bx%7D", "", "13", "0"])
sources.append(["connections-xyz","Esri Transportation", "", "", "", "https://server.arcgisonline.com/ArcGIS/rest/services/Reference/World_Transportation/MapServer/tile/%7Bz%7D/%7By%7D/%7Bx%7D", "", "20", "0"])
sources.append(["connections-xyz","Esri Topo World", "", "", "", "http://services.arcgisonline.com/ArcGIS/rest/services/World_Topo_Map/MapServer/tile/%7Bz%7D/%7By%7D/%7Bx%7D", "", "20", "0"])
sources.append(["connections-xyz","OpenStreetMap Standard", "", "", "OpenStreetMap contributors, CC-BY-SA", "http://tile.openstreetmap.org/%7Bz%7D/%7Bx%7D/%7By%7D.png", "", "19", "0"])
sources.append(["connections-xyz","OpenStreetMap H.O.T.", "", "", "OpenStreetMap contributors, CC-BY-SA", "http://tile.openstreetmap.fr/hot/%7Bz%7D/%7Bx%7D/%7By%7D.png", "", "19", "0"])
sources.append(["connections-xyz","OpenStreetMap Monochrome", "", "", "OpenStreetMap contributors, CC-BY-SA", "http://tiles.wmflabs.org/bw-mapnik/%7Bz%7D/%7Bx%7D/%7By%7D.png", "", "19", "0"])
sources.append(["connections-xyz","OpenTopoMap", "", "", "Kartendaten: © OpenStreetMap-Mitwirkende, SRTM | Kartendarstellung: © OpenTopoMap (CC-BY-SA)", "https://tile.opentopomap.org/%7Bz%7D/%7Bx%7D/%7By%7D.png", "", "17", "1"])
sources.append(["connections-xyz","Strava All", "", "", "OpenStreetMap contributors, CC-BY-SA", "https://heatmap-external-b.strava.com/tiles/all/bluered/%7Bz%7D/%7Bx%7D/%7By%7D.png", "", "15", "0"])
sources.append(["connections-xyz","Strava Run", "", "", "OpenStreetMap contributors, CC-BY-SA", "https://heatmap-external-b.strava.com/tiles/run/bluered/%7Bz%7D/%7Bx%7D/%7By%7D.png?v=19", "", "15", "0"])
sources.append(["connections-xyz","Open Weather Map Temperature", "", "", "Map tiles by OpenWeatherMap, under CC BY-SA 4.0", "http://tile.openweathermap.org/map/temp_new/%7Bz%7D/%7Bx%7D/%7By%7D.png?APPID=1c3e4ef8e25596946ee1f3846b53218a", "", "19", "0"])
sources.append(["connections-xyz","Open Weather Map Clouds", "", "", "Map tiles by OpenWeatherMap, under CC BY-SA 4.0", "http://tile.openweathermap.org/map/clouds_new/%7Bz%7D/%7Bx%7D/%7By%7D.png?APPID=ef3c5137f6c31db50c4c6f1ce4e7e9dd", "", "19", "0"])
sources.append(["connections-xyz","Open Weather Map Wind Speed", "", "", "Map tiles by OpenWeatherMap, under CC BY-SA 4.0", "http://tile.openweathermap.org/map/wind_new/%7Bz%7D/%7Bx%7D/%7By%7D.png?APPID=f9d0069aa69438d52276ae25c1ee9893", "", "19", "0"])
sources.append(["connections-xyz","CartoDb Dark Matter", "", "", "Map tiles by CartoDB, under CC BY 3.0. Data by OpenStreetMap, under ODbL.", "http://basemaps.cartocdn.com/dark_all/%7Bz%7D/%7Bx%7D/%7By%7D.png", "", "20", "0"])
sources.append(["connections-xyz","CartoDb Positron", "", "", "Map tiles by CartoDB, under CC BY 3.0. Data by OpenStreetMap, under ODbL.", "http://basemaps.cartocdn.com/light_all/%7Bz%7D/%7Bx%7D/%7By%7D.png", "", "20", "0"])
sources.append(["connections-xyz","Bing VirtualEarth", "", "", "", "http://ecn.t3.tiles.virtualearth.net/tiles/a{q}.jpeg?g=1", "", "19", "1"])


# Add sources to browser
for source in sources:
   connectionType = source[0]
   connectionName = source[1]
   QSettings().setValue("qgis/%s/%s/authcfg" % (connectionType, connectionName), source[2])
   QSettings().setValue("qgis/%s/%s/password" % (connectionType, connectionName), source[3])
   QSettings().setValue("qgis/%s/%s/referer" % (connectionType, connectionName), source[4])
   QSettings().setValue("qgis/%s/%s/url" % (connectionType, connectionName), source[5])
   QSettings().setValue("qgis/%s/%s/username" % (connectionType, connectionName), source[6])
   QSettings().setValue("qgis/%s/%s/zmax" % (connectionType, connectionName), source[7])
   QSettings().setValue("qgis/%s/%s/zmin" % (connectionType, connectionName), source[8])

# Update GUI
iface.reloadConnections()
In a few moments, you will see there are several online sources added to your QGIS. You can simply drag the layer that you want to open in QGIS.
Thank you for reading this article on how to add multiple online satellite imagery data sources into QGIS. See you in the next article.

