
Surfer is a popular and powerful gridding software. With this tool, you can easily turn your data points into a gridded surface. In this article, I am going to show you how to create a surface grid using Surfer 16. I have a regular survey point data with elevation information in it. Surfer is not the only software that can do this. You may also want to check out my other tutorial on how to create a surface grid using Mapinfo Pro.

In order to create a surface grid, we need to prepare data that contains easting, northing and elevation data. You can save the file in CSV, XLS, XLSX, ACCDB and many more. Surfer 16 supports many types of files.
Steps to create Surface Grid using Surfer 16
- Open Surfer 16
- Create a new plot document. File >> New >> Plot Document
- From the Home tab, click Grid Data.
- Browse your files that contains X, Y, and Z information
- Match the X, Y, and Z columns
- Select the Gridding Method from the list
- Specify the output grid file name and format.

Click OK. Next, select the spatial information for the new grid.

Wait until the gridding process completes. You will see the notification when the process is done.

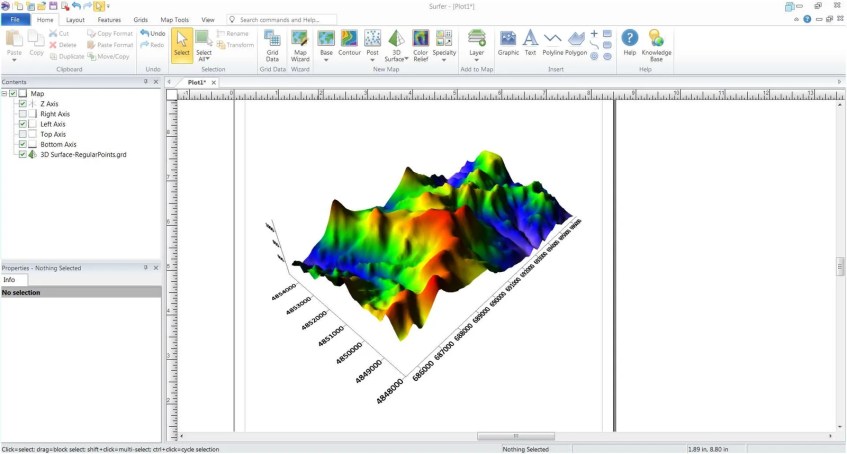
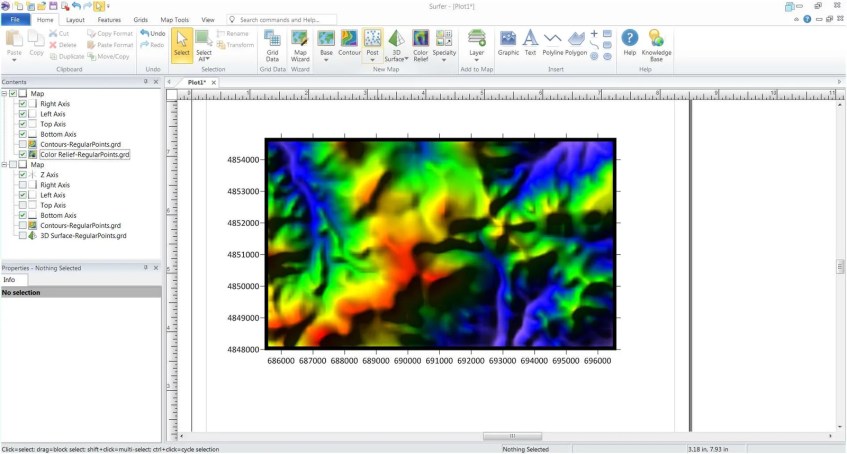
How to Display the Surface Grid
There are several ways to display the grid. You can display it as a 3D surface, contour or color relief.
Thank you. Hope you enjoy the article.
[…] Right-click the Topography folder and select New Topography >> Import Elevation Grid. Browse the elevation grid file and then choose OK. Read how to create a surface elevation grid in Surfer. […]