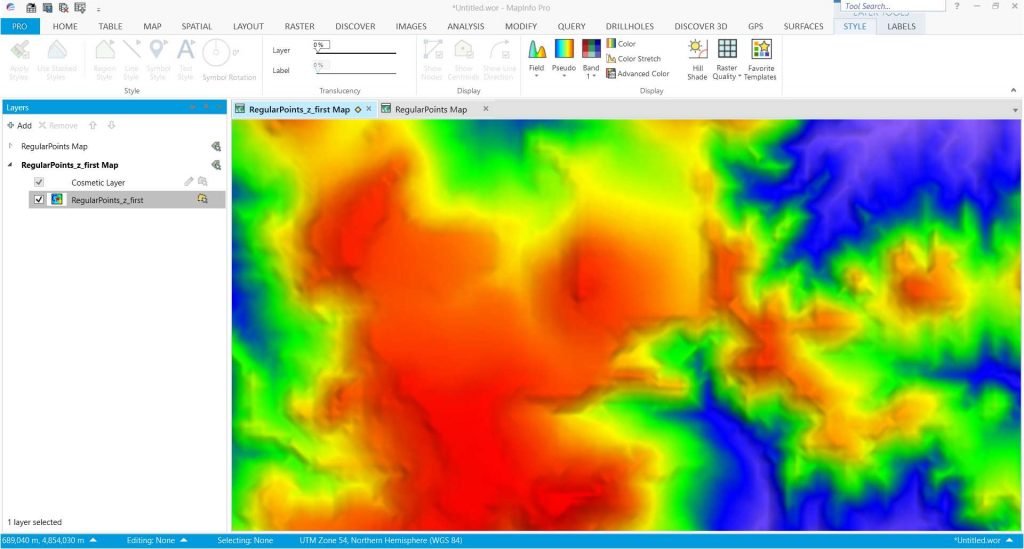
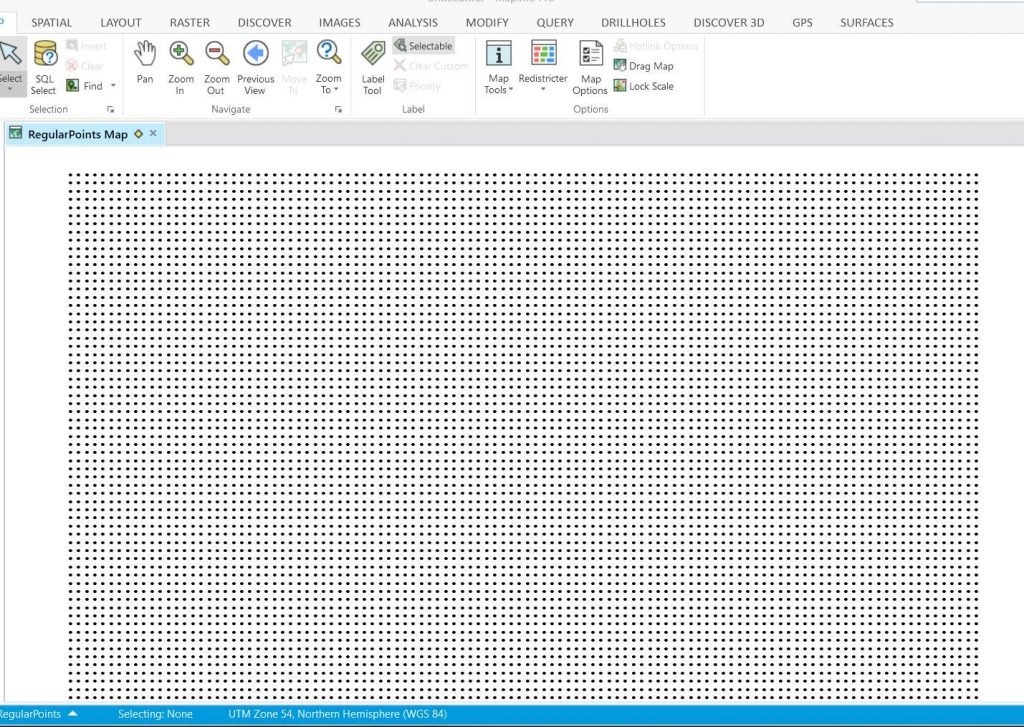
There are numerous ways to display data in Mapinfo Pro. When we have points data with Z value such as elevation, we can display it as an elevation grid. This elevation or surface grid can be used in other software such as Leapfrog Geo, Micromine and many more. The elevation grid is very useful in 3D visualization. This article will show you how to create an elevation grid from point data in Mapinfo Pro.

Mapinfo with Discover is a powerful tool to create the elevation grid. The new Mapinfo Pro 64 bit edition has a better way to produce the elevation surface grid like this.
Steps to Create Elevation Grid in Mapinfo Pro
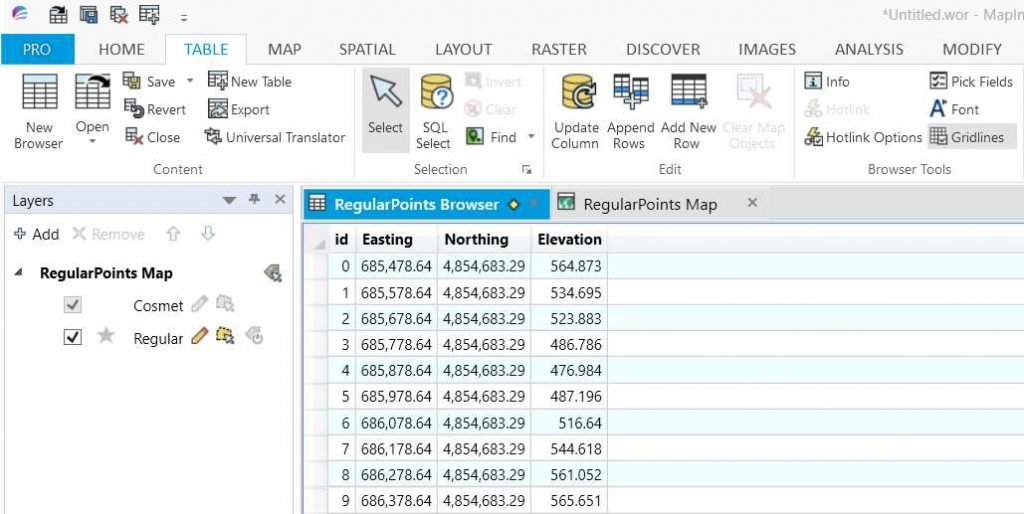
Before we can create a grid, make sure you have a table that has the following information:
- Easting (X)
- Northing (Y)
- Rl (Z)
We will use the Rl for the gridding parameter. In this case, I use the elevation (meters) as the Z value,

Attributes

So now I have easting, northing, and elevation columns. To start the gridding process, follow these steps:
- Go to Surface tab and click Interactive Gridding menu
- Select the layer to create the grid
- In the Interactive Gridding window, select the field to create the grid. In my case, this would be the elevation
- Click Method and select the desired gridding method. I use the triangulation in this example
- Adjust the grid geometry from the Geometry tab
- Finally, select the output format and file name
- Click Save
Thanks for reading.


How to Create Triangulation Surface Grid from Contour Layer in Mapinfo Pro | GIS Tutorial
January 16, 2020[…] a triangulation grid from a contour layer in Mapinfo Pro. In the previous tutorial, I have shown how to create a surface grid from data points. This time is a little bit different but using the same method. So basically, we will turn this […]